 Go figure this one: two houses, side by side, identical floor plans, same orientation, both built by the same crew to the same code. House “A” has R20 insulation in the walls and a respectable 2.6 ACH@50PA, yet it uses almost 400% more energy than house “B” during winter, even though house B only has R17 walls and a somewhat tighter 1.55 ACH@50PA. So what gives? These results came from a year-long study by Dr. Tony Shaw of Brock University as part of a National Research Council project ending in 2001, and they beg a question that more and more evidence points towards: Why do R values so often fail to correspond to real-world energy performance? You’re about to find out.
How Energy Moves
To understand energy performance, you first need to realize that thermal energy moves in three different ways. Conduction is one way, and it happens when energy transfers between materials that are touching each other. Convection is another mechanism of energy transfer, and it happens as warmer and colder air circulates because of differences in density, moving energy around as it does. Radiation is the third method of energy transfer and it needs neither physical contact nor air movement to happen. The energy of the sun travels through millions of miles of empty space and warms the entire globe by radiant transfer alone. So why am I telling you all this? Because different methods of energy transfer are part of the reason why R values never explain the whole energy efficiency story. Even the 2011 National Energy Code Book (NECB) does not require insulation to be tested for resistance to radiation, convection or air infiltration. The R values you see on insulation products everywhere only describe a material’s resistance to conductive heat transfer – as if that’s all there is – and the experiences of a drywaller friend of mine named Pete illustrates why this matters.
Energy Realities
Pete’s the best drywaller I know, and very diligent. That’s why he always brings a broom with him on jobs during winter. “If it’s been cold and windy, the vapour barrier on wood frame walls often looks like the inside of an ice palace,” explains Pete. “I use the broom to knock ice off the vapour barrier before putting up board.”
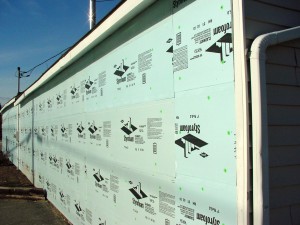 So how could the “warm side” of brand new, code-compliant walls stuffed with R20 batts get so cold that drywall is the only thing hiding the frost? And while you’re wondering, how does a 1”-thick sheet of extruded polystyrene foam with a measly R5 rating feel like it’s warmed by a heater when you put your bare hand on it outside on a cold day? Then there’s the mystery of why an R17 walls kick the butt of R20 walls in a scientifically analyzed energy show-down. The answer to all these questions comes down to the difference between lab analyzed R values and it doesn’t account for significant energy transfers happening in other ways.
R Values Explained
Advertised R values stamped on insulation products come from lab analyzed samples, with these numbers generated in a way that measures conductive heat transfer only. In practice, this means that insulation samples are sealed in a box that eliminates all outside air movement through and around the insulation while the rate of heat transfer is measured. Fair enough. Trouble is, real-world house frames and attics never completely eliminate air movement, and this accounts for a large part of the differences discovered in the Brock University study.
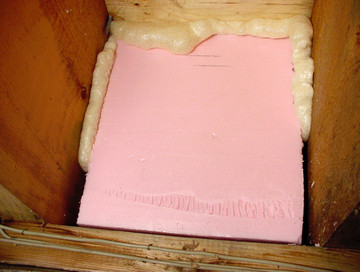
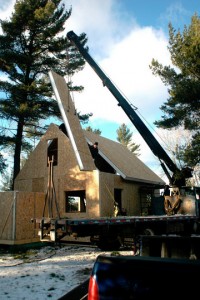 The effectiveness of open-cell insulations, in particular, are vulnerable to wide variation because air can and does move through them in real world conditions, and when this happens it triggers convective energy transfer in addition to conductive transfer. Closed cell insulations, by contrast, are more or less impervious to air movement, so the conductive energy transfer measured in the lab is all there ever is. Convective energy transfer doesn’t happen to any significant extent with closed-cell spray foams and rigid polystyrene foams, for instance, so lab numbers for these materials are the same as field numbers. The Brock test house with R20 walls used batt insulation in wood frame walls with a middle-of-wall temperature range of 5ºC to -6ºC, moving in lock-step with outdoor temperatures as they varied from 0ºC to -15ºC. The R17 house, by contrast, had foam-insulated SIP walls with a middle-of-wall temperature that remained a constant 15ºC (give or take a degree or so) with the same variation in outdoor temperatures. Why the difference between walls that have virtually the same R value? Because R value doesn’t account for convection, radiation and air infiltration.
Need more proof that convection is an especially big factor inside wood frame wall cavities? Simply pull off the cover of any plug outlet on an exterior wall on a windy winter day and the drafts you feel coming out of the electrical box shows how much air moves through wall cavities.
Even on those rare occasions when wall cavities are sealed air tight, convection is still an issue. The bigger the temperature difference between inside and outside wall surfaces, the stronger the forces that drive convection of the air trapped inside the wall itself. In other words, the colder it is outside, the lower the effectiveness of convection-vulnerable insulation. Knowledge of the decreasing effectiveness of open-type insulation has been known at least as far back as 1990, thanks to a roof performance study published by the Roof Research Center at the Oak Ridge National Laboratory (ORNL), in Oak Ridge, Tennessee: “ . . . the thermal resistance of loose-fill fiberglass insulation was found to decrease by a factor of two as the climate chamber temperature was lowered from 7ºC to -28ºC. The variation of thermal resistance follows the same trends as seen in previously published results.” Go to my video tutorial explaining more about how and why all this works.
Another reason for the huge difference in side-by-side efficiency of homes with similar R numbers has to do with the realities of typical wood frame wall construction. According to a 2007 study, also published by the ORNL, “about 30% to 40% of stud wall cavities do not follow nominal framing spacing and require custom cutting and fitting of the batt insulation.” So, how many insulation contractors do you know who take the time to custom cut one batt out of every three to get the fit just right?
Another issue is an unavoidable part of stud frame walls, even when they’re built perfectly. According to a 2002 study by the California Energy Commission, 27% of residential wall surfaces have framing members that span the entire thickness of walls. A similar study performed by ASHRAE in 2003 found an average framing factor of 25%. With wood coming in a slightly under R1 per inch, this means that fully one quarter of the surface area of all exterior stud frame wall surfaces are only worth R6, even though everyone pretends they’re R20.
The difference between stated insulation product R values and measured energy performance takes on special significance as energy-based building code changes kick in across North America. In a growing number of regions, builders are allowed to follow one of two ways to meet code. Houses can be built and individually tested to see if they meet energy standards, or they can be built according to a recipe, without testing. The assumption behind the recipe approach is that if you build in a certain way – using insulation products with the right numbers printed on the bag – E80 energy performance will be achieved. So how true is this?
A partnership between the City of Vancouver, the Greater Vancouver Homebuilders Association and the E3 EcoGroup set out to answer this question by measuring the actual energy performance of 300 homes. On average, houses built according to a recipe that was supposed to achieve an Energuide E80 performance delivered actual results in the E76 to E77 range. Sounds insignificant? Not when you realize how the Energuide scale works. It’s a logarithmic scale – like the Richter scale for earthquakes – so the differences between rating numbers increases exponentially as they go up. An E86 house, for instance, uses 50% less energy than an E80 house. Homeowners with E80 houses built according to a prescriptive recipe are most likely getting performance that’s costing them 29% more each year, for the 70, 80 or 100 years the house will be around.
One reason for the discrepancy between expected and actual performance goes back to the way theoretical Energuide performance is predicted. It’s based on HOT2000 software which, once again, only considers conductive heat loss and not convection and radiation. With current measurement standards, testing is the only way homeowners can be sure that an E80 home actually delivers E80 performance.
The whole idea of rating insulation by R values must have been a welcome improvement from the days when sawdust in wall cavities was top-notch technology. But today, homeowners expect a level of home energy performance that’s never been delivered before in large numbers and so does government. As the energy performance bar rises because of code changes and consumer expectations, we need an insulation rating system that tells all the useful facts at a glance, not just one of those facts. Besides being a technical issue, insulation ratings are also highly political, with powerful business sectors more than interested in keeping things as they are. While the rest of the world continues to be kept wondering why R values don’t correspond to actual energy performance, now you’ve got what it takes to understand things clearly and build better because of it.
MORE INFO: R-Zero, Yet Worth A Lot
Radiant barrier foil is a striking example of how R values don’t tell the whole energy story. These shiny, aluminum sheets have virtually no R value in and of themselves, yet they do wonders for making homes more comfortable. Installed in attics over existing thermal insulation, radiant barriers help reflect summertime attic heat upwards, away from rooms. They reflect radiant energy quite effectively, yet this useful quality isn’t communicated by R values at all.


